Debugging SPI
In this lab we use a logic analyzer to debug the SPI protocol being used to drive a sample OLED device. We will be using the the 8 port Saleae Logic Analyser. The retail cost is about $399.00 although there are lower cost logic analyzer available.
OLED SPI settings
Our OLED device has seven wires. In addition to power and ground there a five data connections we will be observing on our logic analyzer.
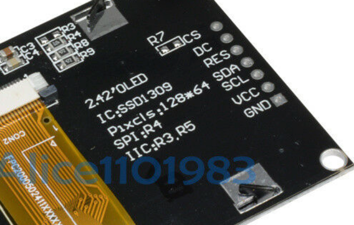
- CS - Chip Select pin 4
- DC - Data/Command - pin 5
- RES - Reset - pin 6
- SDA - Data - SPIO TX GP7 pin 10 (Data from the )
- SCL - Clock - Connect to SPIO SCK GP6 pin 9
- VCC - Connect to the 3.3V Out pin 36
- GND - pin 38 or 3 any other GND pin
Setting up a Logic Analyzer
Setup SPI Analyser
Configure SPI Channel Settings
Saleae Logic Analyser SPI Logic Analyser Settings
Check a Working Device
The first thing we want to see is what the signals to a working SPI OLED should be. There are plenty of working drivers for the Arduino, so I hooked one up to the Logic analizer to see what they were.
Viewing Data Clock and RES
All five signals
DC and CS signals have a larger period.
- DC on was 3.668 milliseconds
Clock Period
Our Clock (SCL) has 8 positive pulses with a width of .4167 microseconds. This means that the positve/negative combined width has a period of 2 * .4167 = .8333 microseconds. This can be converted into a frequency of 1.2 megahertz.
References
Video on how to use the Saleae Logic Analizer
https://www.youtube.com/watch?v=Ak9R4yxQPhs